How to Use Database Replay:
The new Database Replay tool works like a DVR inside the database. Using a unique approach, it faithfully captures all database activity beneath the level of SQL in a binary format and then replays it either in the same database or in a different one (which is exactly what you would want to do prior to making a database change). You can also customize
the capture process to include certain types of activity, or perhaps exclude some.
Database Replay delivers half of what Oracle calls Oracle Database 11g’s Real Application Testing option; the other half is provided by another tool, SQL Performance Analyzer. The main difference between these two tools is the scope involved: whereas Database Replay applies to the capture and replay of all (subject to some filtering) activities in a database, SQL Performance Analyzer allows you to capture specific SQL statements and replay them. (You can’t see or access specific SQLs captured in Database Replay, while in SQL Performance Analyzer you can.) The latter offers a significant advantage for SQL tuning because you can tweak the SQL statement issued by an application and assess its impact. (SQL Performance Analyzer is covered in a forthcoming installment in this series.)
Conceptually, Database Replay works in the sequence shown in the figure below.
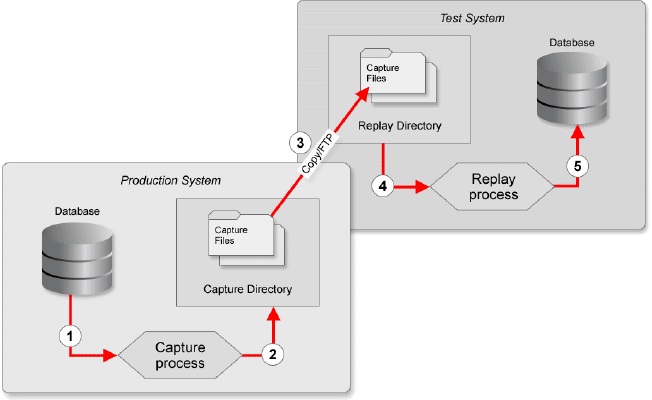
- You start a capture process that records activities against the database.
- The process writes the activities to special files called “capture files” in a directory called /capture directory/.
- After a while you stop the capture process and move these capture files to a test system in a directory called /replay directory/.
- You start a replay process and several replay clients to replay all these capture files.
- The capture files are applied against the test database.
So, what does Database Replay provide that third-party tools don’t? Well, other tools merely replay several synthetic statements, which you provide. In contrast, Database Replay does not need you to provide SQL statements. Since it captures all activity underneath the SQL, you don’t risk missing out on some key operations that may be the root of any performance issue. In addition, since you can capture selectively—for specific users, programs, and so on—and you can specify a time period when the workload is captured, you can replay specific workloads that cause you problems, not the entire database.
For instance, you notice that the month-end interest calculation program is causing issues and you suspect that changing a parameter will ease the process. All you have to do is capture the workload for the duration the month-end program runs, make the change in parameter on a test system, and then replay the capture files on that test system. If the performance improves, you have your solution. If not, well, it’s only a test system. You didn’t impede the operation of the production database.
That means Database Replay functionality of Oracle 11g allows you to capture workloads on a production system and replay them exactly as they happened on a test system. This provides an accurate method to test the impact of a variety of system changes including:
- Database upgrades.
- Operating system upgrades or migrations.
- Configuration changes, such as changes to initialization parameters or conversion from a single node to a RAC environment.
- Hardware changes or migrations.
The capture and replay processes can be configured and initiated using PL/SQL APIs, or Enterprise Manager, both of which are demonstrated in this article. To keep things simple, the examples presented here are performed against two servers (ORCL-11g and catdb-11g), both may or may not run an identical database with any SID.
Thank you for reading…This is Airy…Enjoy 🙂